Spreadsheets are great tool for farm managers.
This is our second blog post on Excel tips and tricks for farmers. We’re going to take a look at the VLOOKUP function which is probably tied with Data Tables as my favorite piece of Excel functionality. Here is a link to our previous blog post on data tables: Excel for Farmers: Data Tables
VLOOKUP is a function that is used to pull a specifc piece of data from a list. In the video below, we use VLOOKUP to setup a drop-down list that calculates the price of seed corn per acre depending on what variety you select from the list. This is a great tool for small price comparisons or as part of a larger farm financial tracking tool.
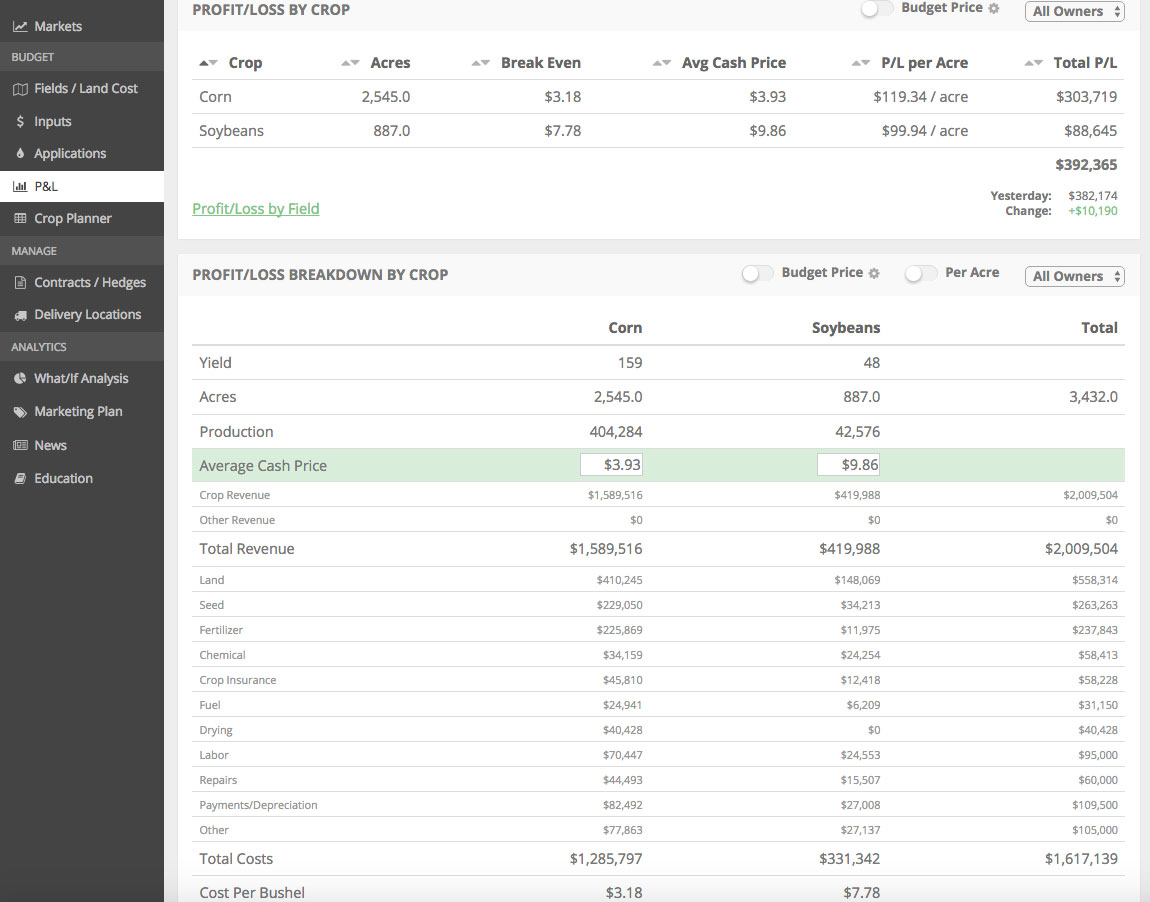
On a different note, we’ll be releasing our farm finance software tool on June 15th. We’ll be hosting a webinar that day to provide an overview of its functionality and give more insight into our long-term vision for helping our customers thrive in the ever-volatile farm economy.
Spreadsheets are great for simple analysis or building a one-year farm income statement. Where they begin to show their weakness is when farmers try to conduct multi-year financial analysis. Farming is a unique business where every year is essentially a stand-alone business. A great farm business manager should be easily able to conduct multi-year peformance analysis.
Also, spreadsheets lack when pieces of the data are ever-changing (eg. commodity prices). They also don’t contain the ability to notify you if/when certain farm peformance targets are met.
I’m not shy about it, I love spreadsheets! But it’s also my passion to build a tool that fills in their weaknesses.
Keep an eye out for our upcoming webinar!

Nick Horob
Passionate about farm finances, software, and assets that produce cash flow (oil wells/farmland/rentals). U of MN grad.
Related Posts
Excel For Farmers: Data Tables
This is the first post in a series that will focus on how Microsoft Excel tips and tricks for farmers. Spreadsheets are an awesome tool for any farm decision maker!
Read More »
